Functions
Representation of the complex value of a function of a complex variable
In the real domain functions are easily represented by plotting f(x) vs. x on a two dimensional plot. For complex variables the equivalent would be easy in four dimensions, but we have at most three to work with (and only two on a piece of paper!) If only we lived in a 5 dimensional world where we had 4 dimensional paper. But not to worry. We have with the advent of the computer an easy way to represent the two variable result of the complex function by using color.
So for each point in an Argand diagram of the argument z of f(z) we can represent the result (r+ib)=f(z) as a color combining an amount of red corresponding to the real part and an amount of blue corresponding to the imaginary part. The trick which makes the result intelligible is to scale the result properly and then show the result modulo 256. In the computer, the color is usually represented by one integer of the form 0x10000*blue+0x100*green +0x01*red. (Sometimes blue and red are interchanged and other arrangements are also possible.) Each of the colors can range in intensity from 0 to 255. The color 0x000000 is black and the color 0xffffff is white.
The real values r and b of the result (which will no doubt be in some floating form)can be modified and combined to make a color:
int rr=s*256*r; bb=s*256*b;
Here is a scale factor which allows adjustment of the fineness of the repetition of the color (the spacing of the contour lines as it were.) I find it is often fairly pleasing to use s=5 for the scale.
Finally the combined color in the computer's representation is:
Int color=0x10000*(bb&0xff) + (rr&0xff);
The anding with 0xff produces modulo 256 values for the color components. This is both necessary for the color representation and conveniently produces the “contour” effect which makes the representation interpretable. Below is shown the representation in this form of the function 1/z.
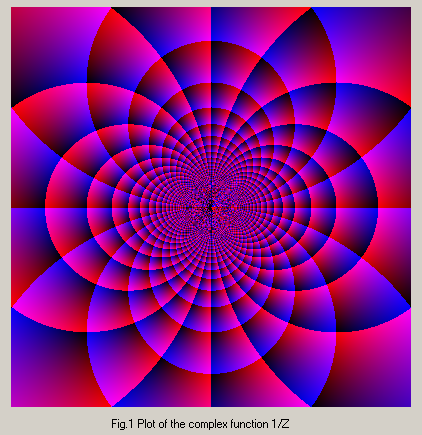
With this representation the direction in which the real or imaginary part increases is toward the higher intensity in that color. Thus it is easy to see that the function increases as we go toward 0 from the positive side (as we expect from 1/x in the real space) and decreases as we approach zero from the left (increasingly large negative numbers).
The code which produced this diagram is:
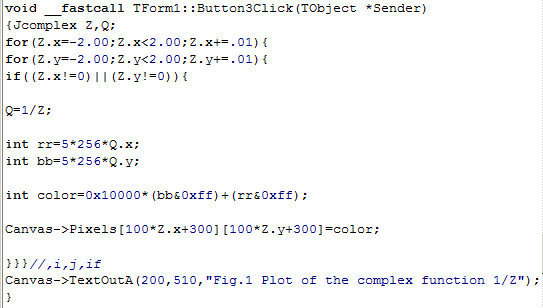
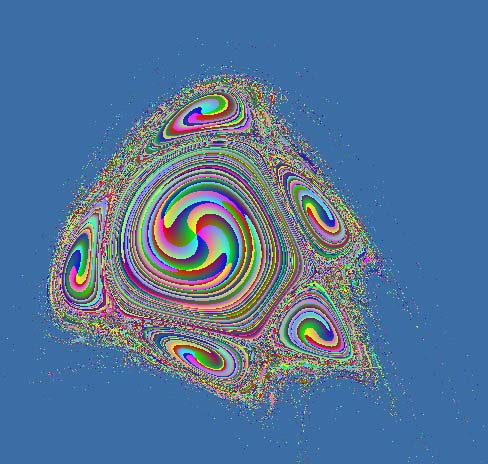
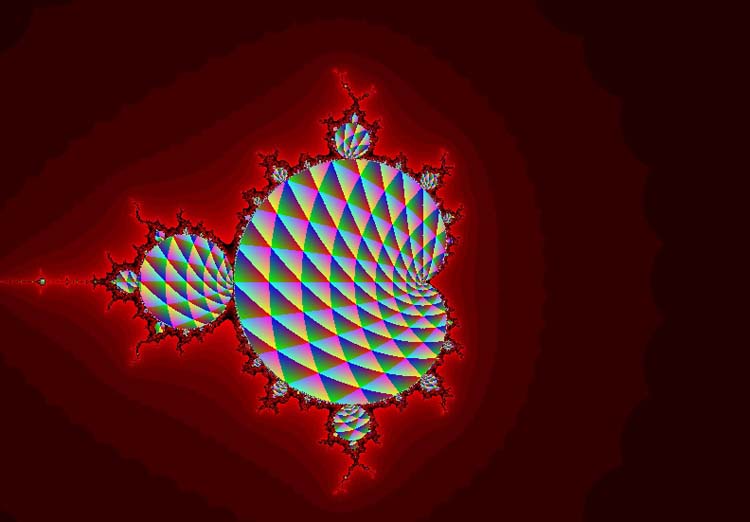
Several complex functions are shown below, some with more artistic color representation.
|
|
|
|
|
Area Preserving Map |
R+iG=exp(x+iy) |
R+iB=ln(x+iy) |
|
|
|
|
|
R+iG=1/(z*z-1) |
R+iB=1/(x+iy) |
R+iB=ln(z-1)-ln(z+1) |
|
|
|
|
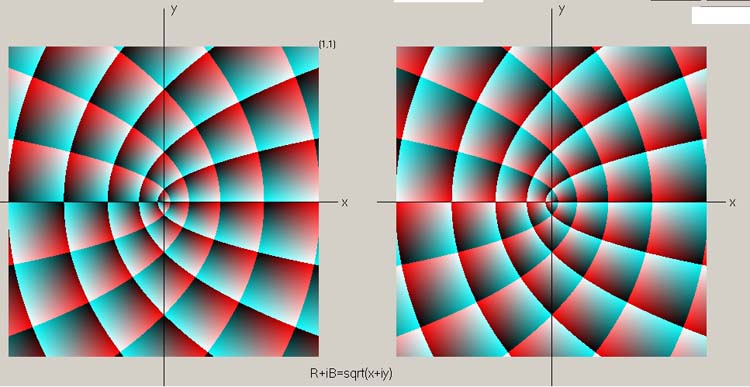
|
R+iB=sqrt(x+iy) |
Sinkhorn |
Mandelbrot |